

Introduction
Across Europe, supervisors such as EIOPA, the ECB and the ACPR increasingly expect insurers to assess the potential impact of climate change on their balance sheets.
This regulatory trend will continue regardless of international political uncertainty. Climate risks — both physical and transition-related — are already reshaping profitability, pricing, reinsurance strategies, asset allocation and long-term solvency.
To support insurers in these assessments, Elseware has developed a simple, structured, and fully transparent quantitative framework for estimating the impact of climate scenarios on:
- Equity portfolio,
- Corporate bonds portfolio,
- Sovereign bonds portfolio,
- Life insurance liabilities,
- Non-life insurance liabilities.
The method deliberately avoids unnecessary granularity. Instead, it focuses on coherence, clarity and auditability, making it ideal for ORSA exercises, internal stress tests and long-term strategic analysis.
1. Three scenarios, one common foundation
The framework relies on the public scenarios of the NGFS (Network for Greening the Financial System), now widely adopted by European supervisors.
These scenarios illustrate three possible paths:
- Orderly: early transition compatible with 1.5–2°C,
- Disorderly: delayed and costly transition,
- Hot House: insufficient action, higher warming.
NGFS provides a consistent set of assumptions covering:
- Ttemperature pathways,
- Emissions trajectories,
- Implicit carbon prices,
- Macroeconomic impacts on GDP.
Elseware uses these as a neutral and transparent baseline for all downstream calculations.
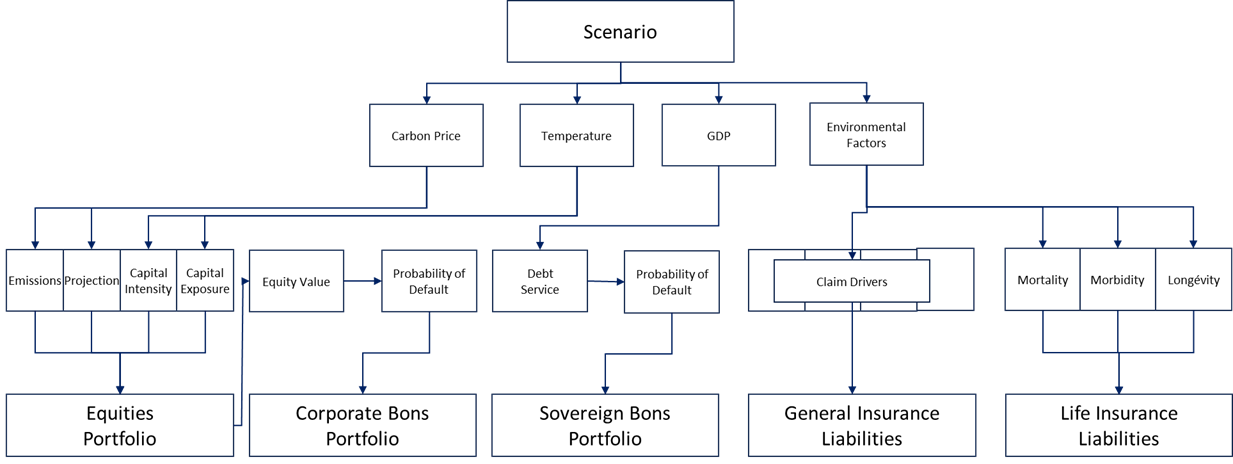
2. A balance-sheet view of climate exposure
The analysis is structured around six major categories of exposure:
Assets
- Equities → by NACE sector
- Corporate bonds → by NACE sector
- Sovereign bonds → by country
Liabilities
- Non-life insurance → by line of business
- Life insurance → by mortality, morbidity and longevity sensitivities
For each category, the model defines:
- A low impact assumption,
- A central impact assumption,
- A high impact assumption.
These feed into a portfolio-wide simulation producing a continuous distribution of climate stress on the balance sheet.
3. Equities & corporate bonds: from value-added shocks to default probabilities
The economic logic behind the modelling of corporate assets is intentionally clear and easy to audit.
Transition risk
A sector’s value added is shocked proportionally to:
- its current carbon intensity,
- its projected ability to reduce emissions,
- the carbon price implied in the scenario.
Physical risk
Each sector is affected differently according to:
- Exposure of its capital to physical hazards,
- Its capital intensity (EU-KLEMS, ECB NEAR),
- The macroeconomic impact on the countries where it operates.
Market value adjustment
A value-added shock is translated into a change in market valuation using transparent, sector-level assumptions.
Probability of default
Elseware uses a simplified structural logic (Merton-type), whereby:
- A drop in firm value increases distance-to-default,
- Precomputed lookup tables convert value shocks into PD multipliers.
Corporate bond valuation
The new PD drives a repricing of corporate bonds using sensitivity tables.
This entire chain is fully documented and remains free of any black-box components.
4. Sovereign bonds: from GDP shock to implied sovereign credit risk
Sovereign exposures are modelled via a four-step process:
- GDP shock from the NGFS scenario, country by country.
- Propagation to government revenues.
- Adjustment of sovereign default probability using a simple elasticity-based rule.
- Valuation impact using sovereign duration and spread sensitivity tables.
This approach naturally differentiates countries: warmer and more exposed regions (Middle East, South Asia) exhibit stronger deterioration than temperate, diversified economies (Northern Europe).
5. Insurance liabilities: a structured, factor-based method
For insurance liabilities, Elseware uses a factorised, matrix-based approach built on three layers:
Scenario → Environmental Factors
Derived from IPCC documentation: extreme weather, heat, vector-borne diseases, pollution, conflicts, etc.
Environmental Factors → Claim Drivers
Examples:
- Weather extremes affect CAT events and property damage,
- Heat influences accident severity or social behaviour,
- Pandemics influence health and disability claims.
Claim Drivers → Insurance Lines
Each line of business (Motor, Property, Liability, Health, Protection, etc.) has a specific sensitivity profile.
This transforms a climate scenario into a technical stress on claims and actuarial assumptions, directly usable in internal models.
6. Simplicity, transparency, auditability
The framework follows a guiding principle: prioritise clarity over unnecessary complexity.
Compared to proprietary climate-risk engines, Elseware’s approach:
- Uses exclusively public data,
- Makes every parameter explicit,
- Clearly separates data, assumptions, and expert judgment,
- Allows rapid recalibration,
- Integrates seamlessly into ORSA processes,
- Avoids reliance on opaque vendor models.
It is therefore a balanced solution between:
- Economic realism,
- Operational feasibility,
- Regulatory auditability.
Conclusion
In a world facing both climate uncertainty and increasing supervisory expectations, insurers need analytical frameworks that are simple, transparent, scenario-consistent, traceable, and aligned with Solvency II and NGFS.
The approach developed by Elseware achieves precisely this balance. It provides a structured, robust and explainable estimate of climate impacts across the entire balance sheet, while giving insurers full control over assumptions and interpretations.
Elseware supports insurers in risk modelling using transparent, flexible and regulator-ready methodologies.
